


GCN Circular 7777
Subject
Reactivation of SGR 1627-41
Date
2008-05-29T00:34:50Z (16 years ago)
From
David Palmer at LANL <palmer@lanl.gov>
D. Palmer (LANL), P. Esposito (INAF-IASF Milano), S. Barthelmy (GSFC),
J. R. Cummings (GSFC/UMBC), N. Gehrels (GSFC),
G. L. Israel (INAF-OA Roma), H. Krimm (GSFC/USRA),
T. Sakamoto (GSFC/ORAU), R. Starling (U. of Leicester)
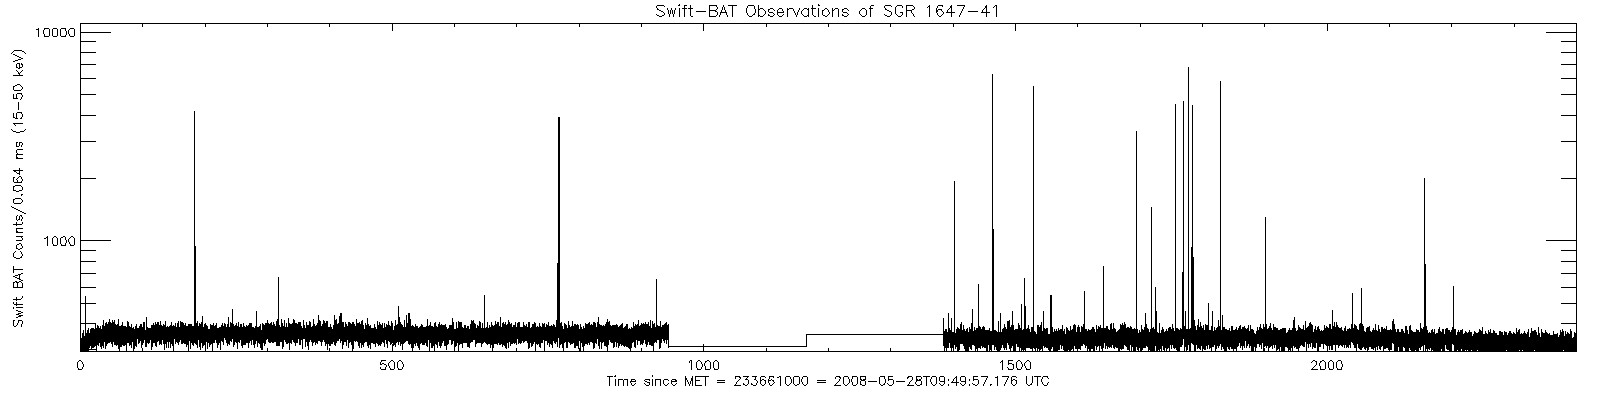
Swift has detected the resumption of activity of Soft Gamma Repeater
SGR 1627-41 after a 9.8-year long quiescent period. BAT detected
the initial burst on 2008-05-28 at 08:21:43 UT, and a larger burst
at 09:53:00. This was followed by a 'forest' of dozens of bursts
extending at least to 10:25:54. The brightest burst seen thus far
has a 15-50 keV flux of 550 times the Crab, averaged over
a 0.128 second time interval.
Following the BAT detection, Swift observed the source with XRT on
2008 May 28th, starting from 12:58:14 UT.
This SGR was discovered in 1998 June when it emitted over 100 bursts
clustered within 6 weeks (Kouveliotou et al. 1998, IAU Circ. 6944, 2;
Woods et al. 1999, ApJ 519, L139); no further burst emission has been
reported to date.
Preliminary results, based on the first 2 ks XRT observation, found a
persistent and relatively constant X-ray source with a count rate of
0.06 +/- 0.01 cts/s at a position RA, Dec = 16 35 51.9, -47 35 23.0
(J2000) with an uncertainty of 4.1 arcsec (radius, 90% confidence
level).
This position is consistent with the Chandra coordinates of the SGR
(Wachter et al. 2004, ApJ 615, 887).
The paucity of detected photons did not allow us to carry out a
sensitive search for coherent pulsations (upper limits > 100% pulsed
fraction at 3 sigma c.l.).
A single absorbed black body model fits well the spectrum with
nH=6.8x10^22 cm^-2 and kT=0.8 keV (Mereghetti et al. 2006, A&A
450, 759). The observed flux is 6.5x10^-12 erg/cm2/s (unabsorbed:
7.3x10^-11). This persistent luminosity is the highest ever recorded
from this source (and a factor ~50 higher than the September 2004
XMM-Newton values; Mereghetti et al. 2006).
Analysis of data from this burst is continuing, and will be reported
in later circulars.
A plot of the BAT light curve for the forest can be seen at
<http://gcn.gsfc.nasa.gov/gcn/other/SGR1627-41_timeline_2008.png>.
The timeline of the previous outbursts can be seen at
<http://gcn.gsfc.nasa.gov/gcn/other/SGR1627-41_timeline.gif>.
We thank the Swift Operations Duty Scientist and
Flight Operations Team for performing a rapid ToO.
This GCN is also being submitted as an ATEL.